Responses dashboard
A Pro feature. Upgrading a single form doesn't include it. See Plans & pricing.
Opening it
- Choose Responses in the header, for all your forms. On a phone it's in the menu under your initials.
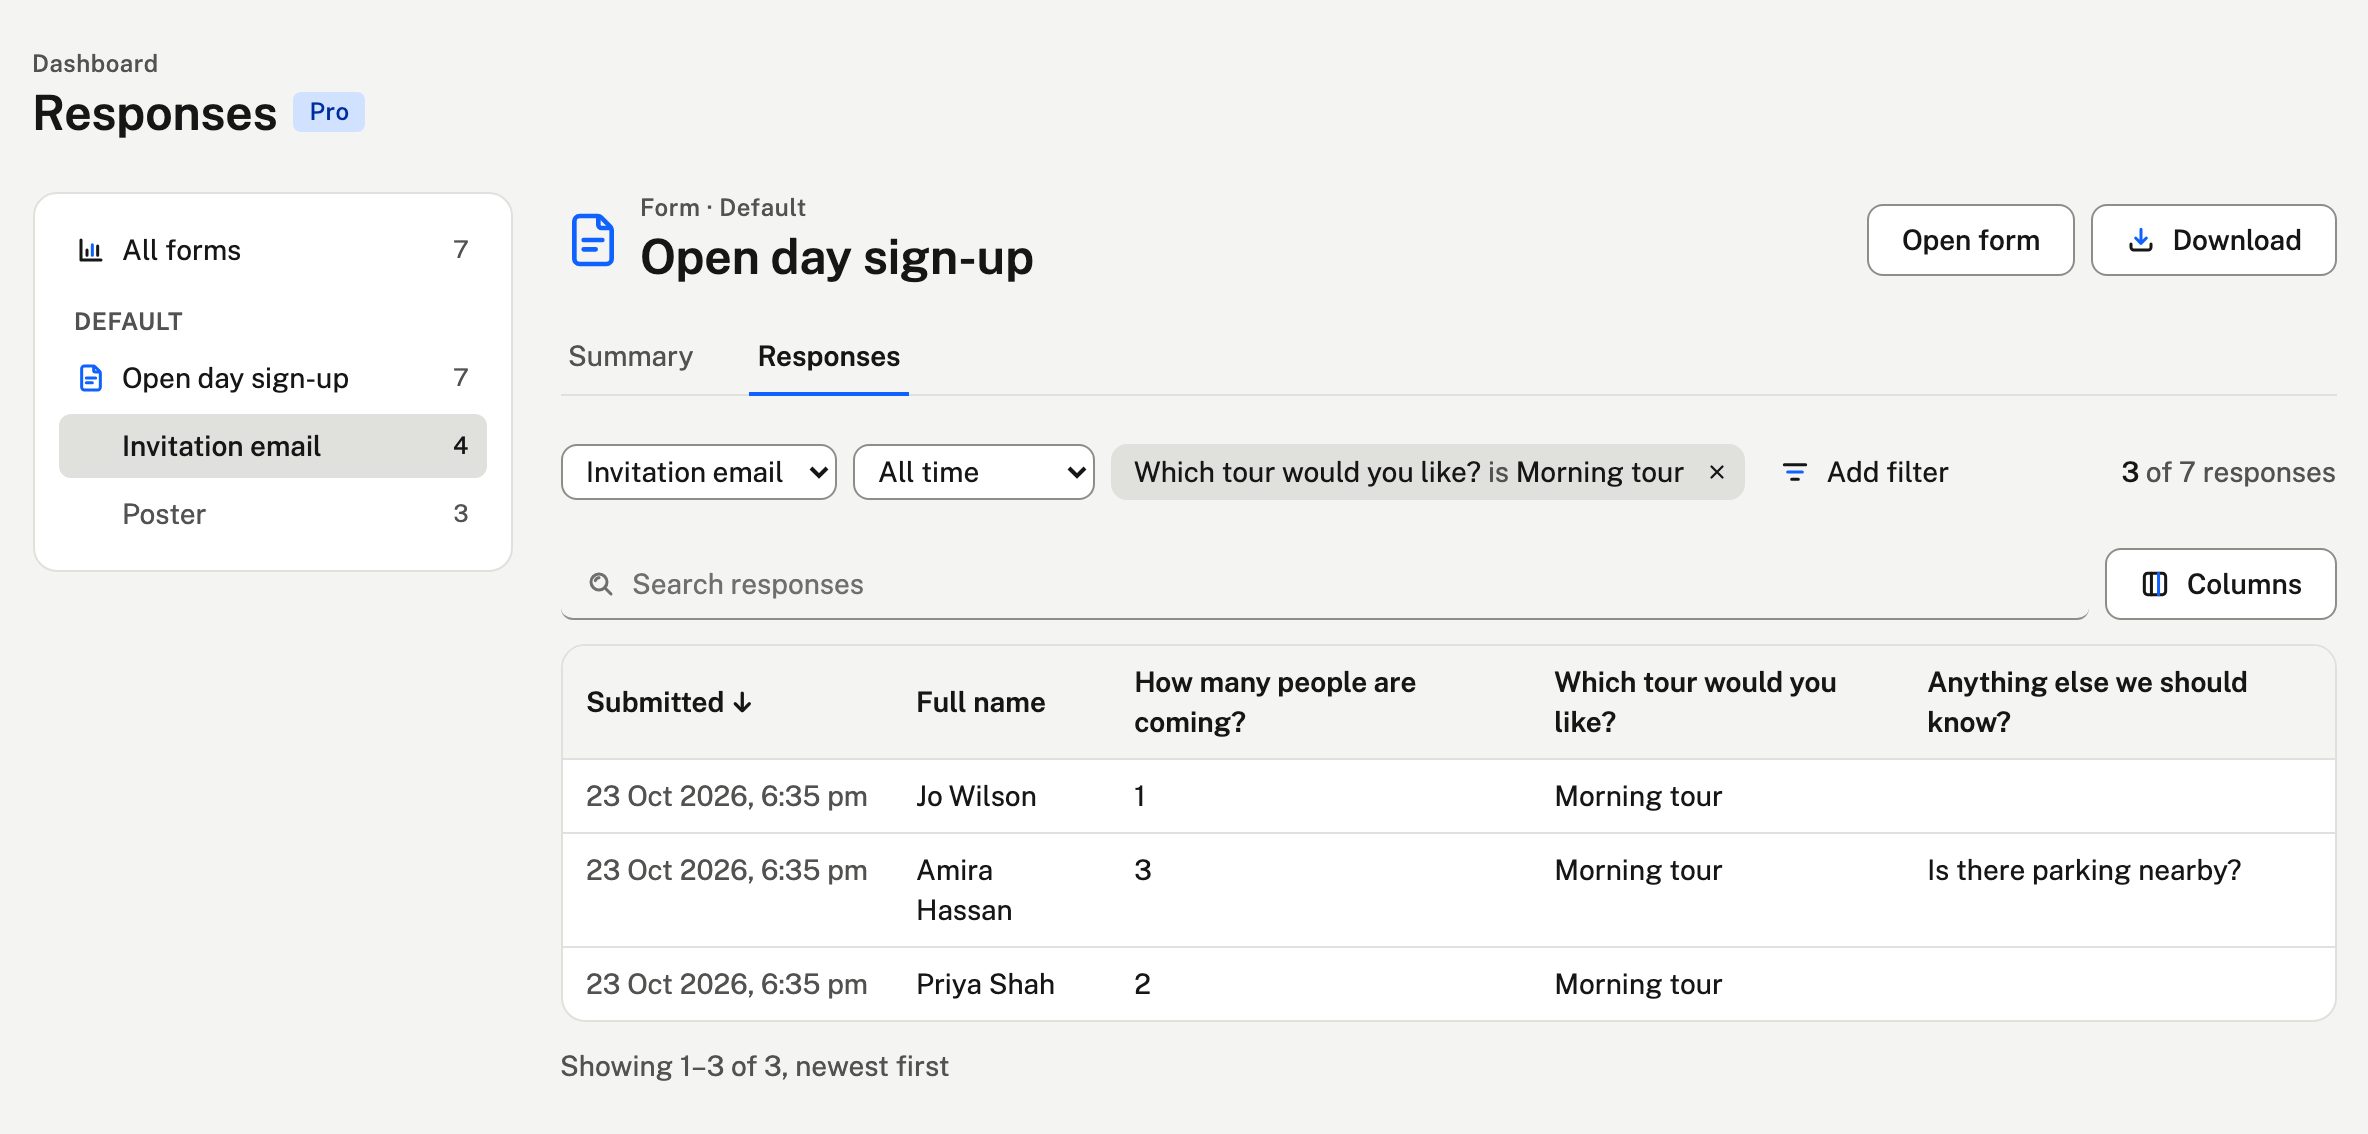
- Or choose Dashboard on a form's page, or beside Download on a link's responses, to go straight to that form or link.

All forms
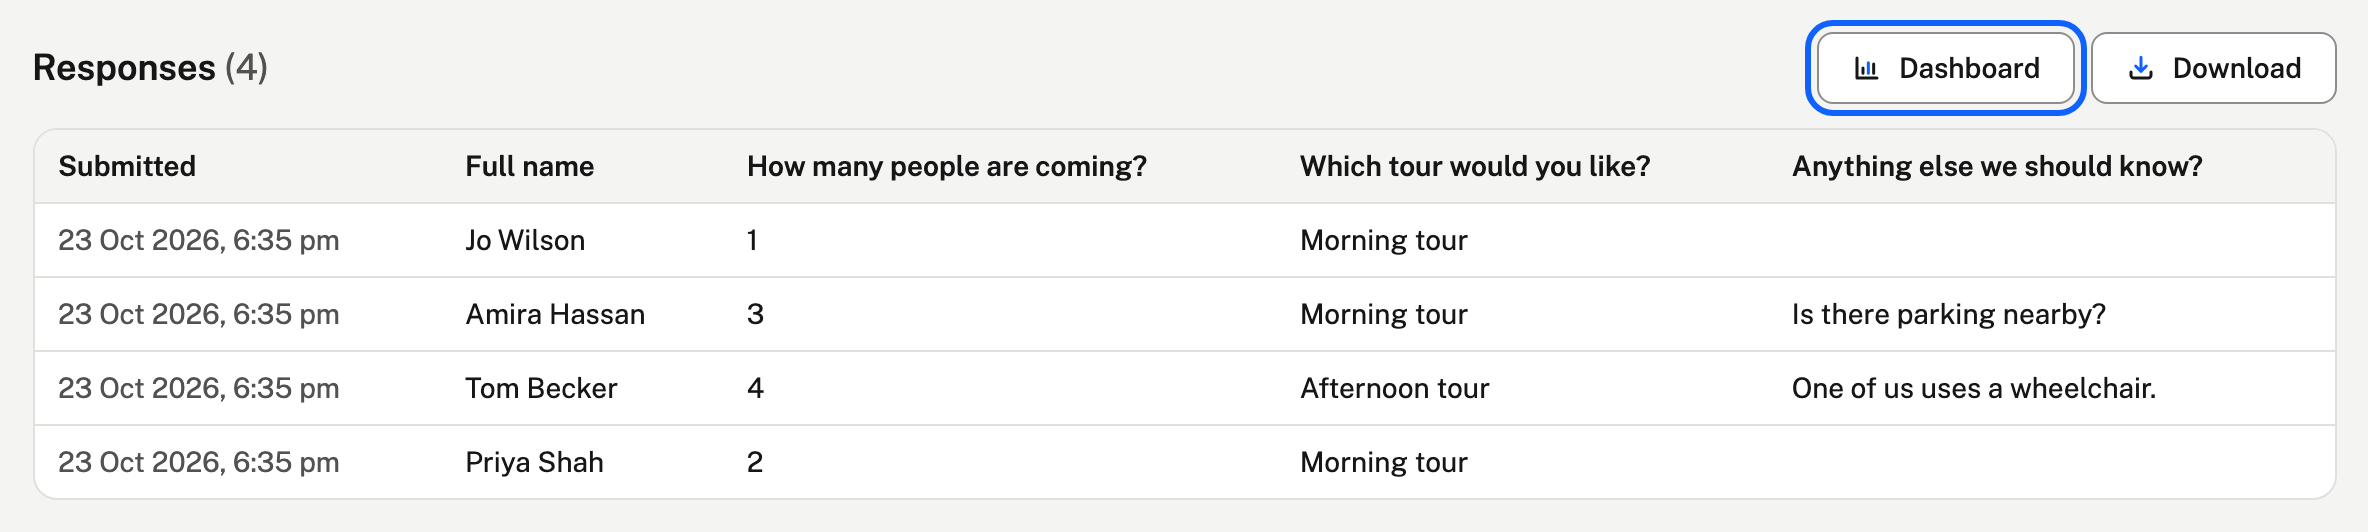
Responses this month and in total, how many forms are taking responses, responses a day for the last 30 days, and every form with its count and how many arrived in the last week.
One form
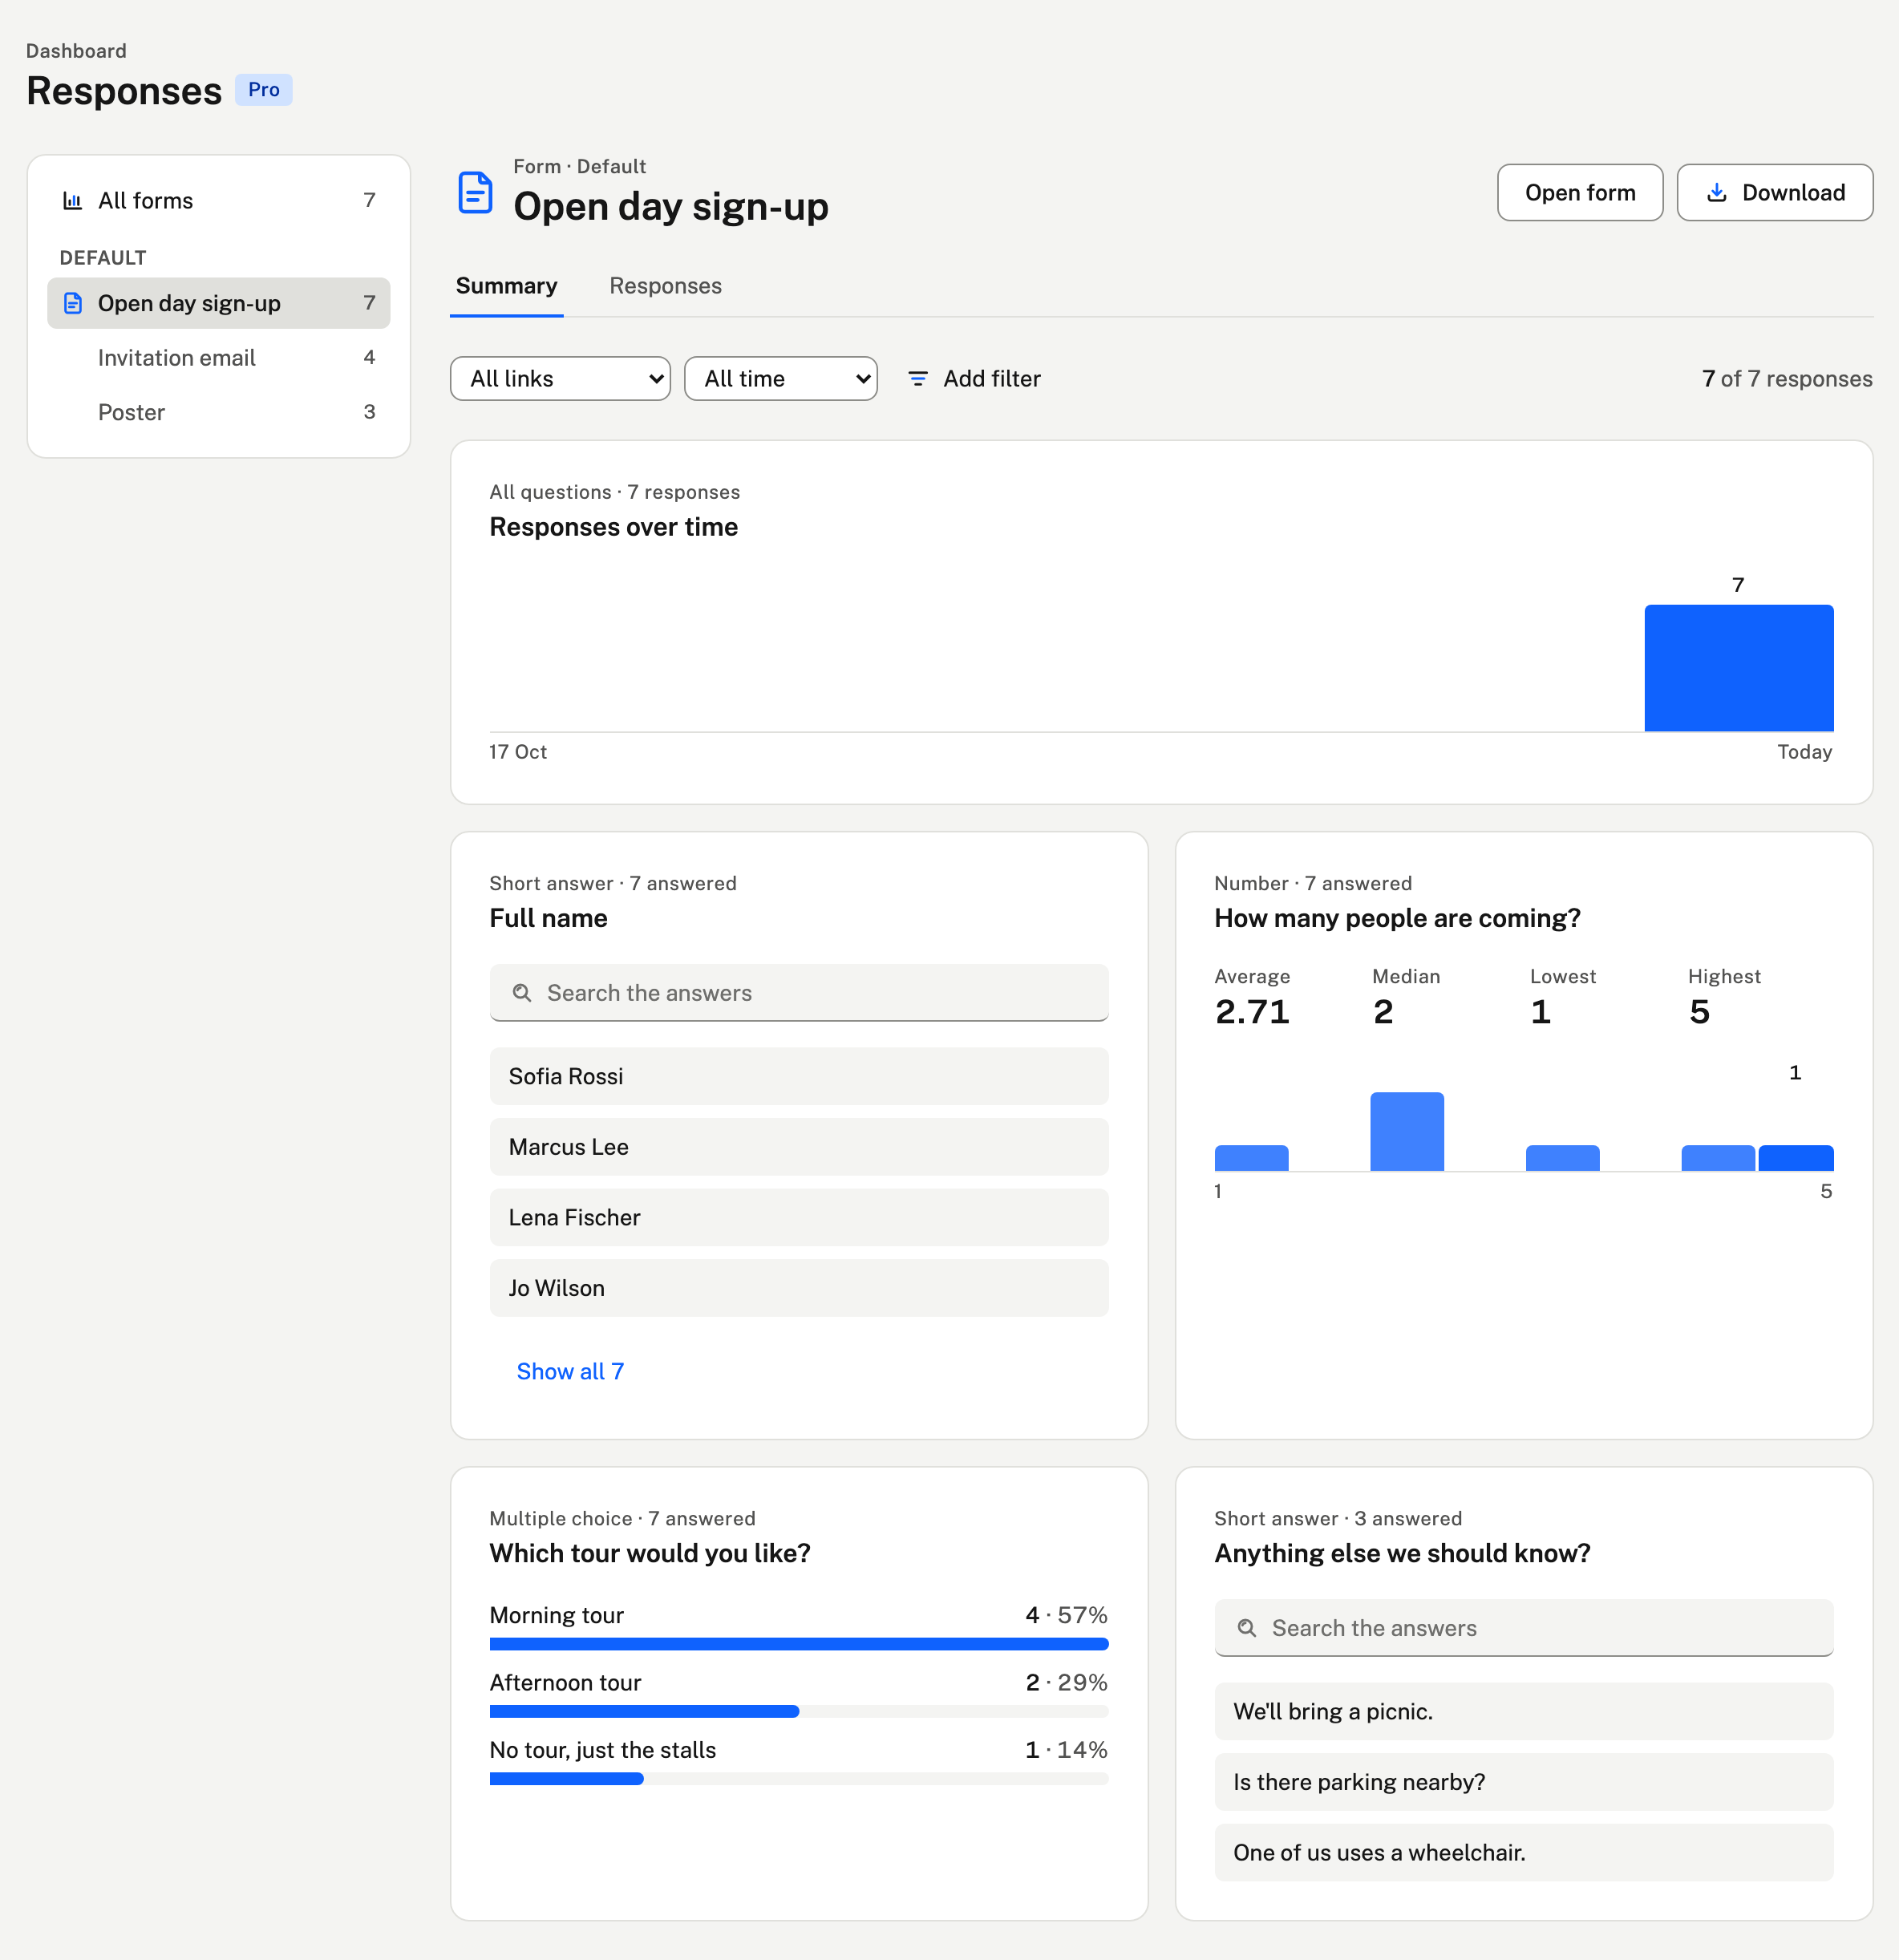
- Summary has a card for each question: a bar for each option of a multiple-choice or checkbox question, the average, median, lowest and highest of a number with how they're spread, the range of a date, and text answers you can search. Questions since removed from the form are still there, marked "(removed)".
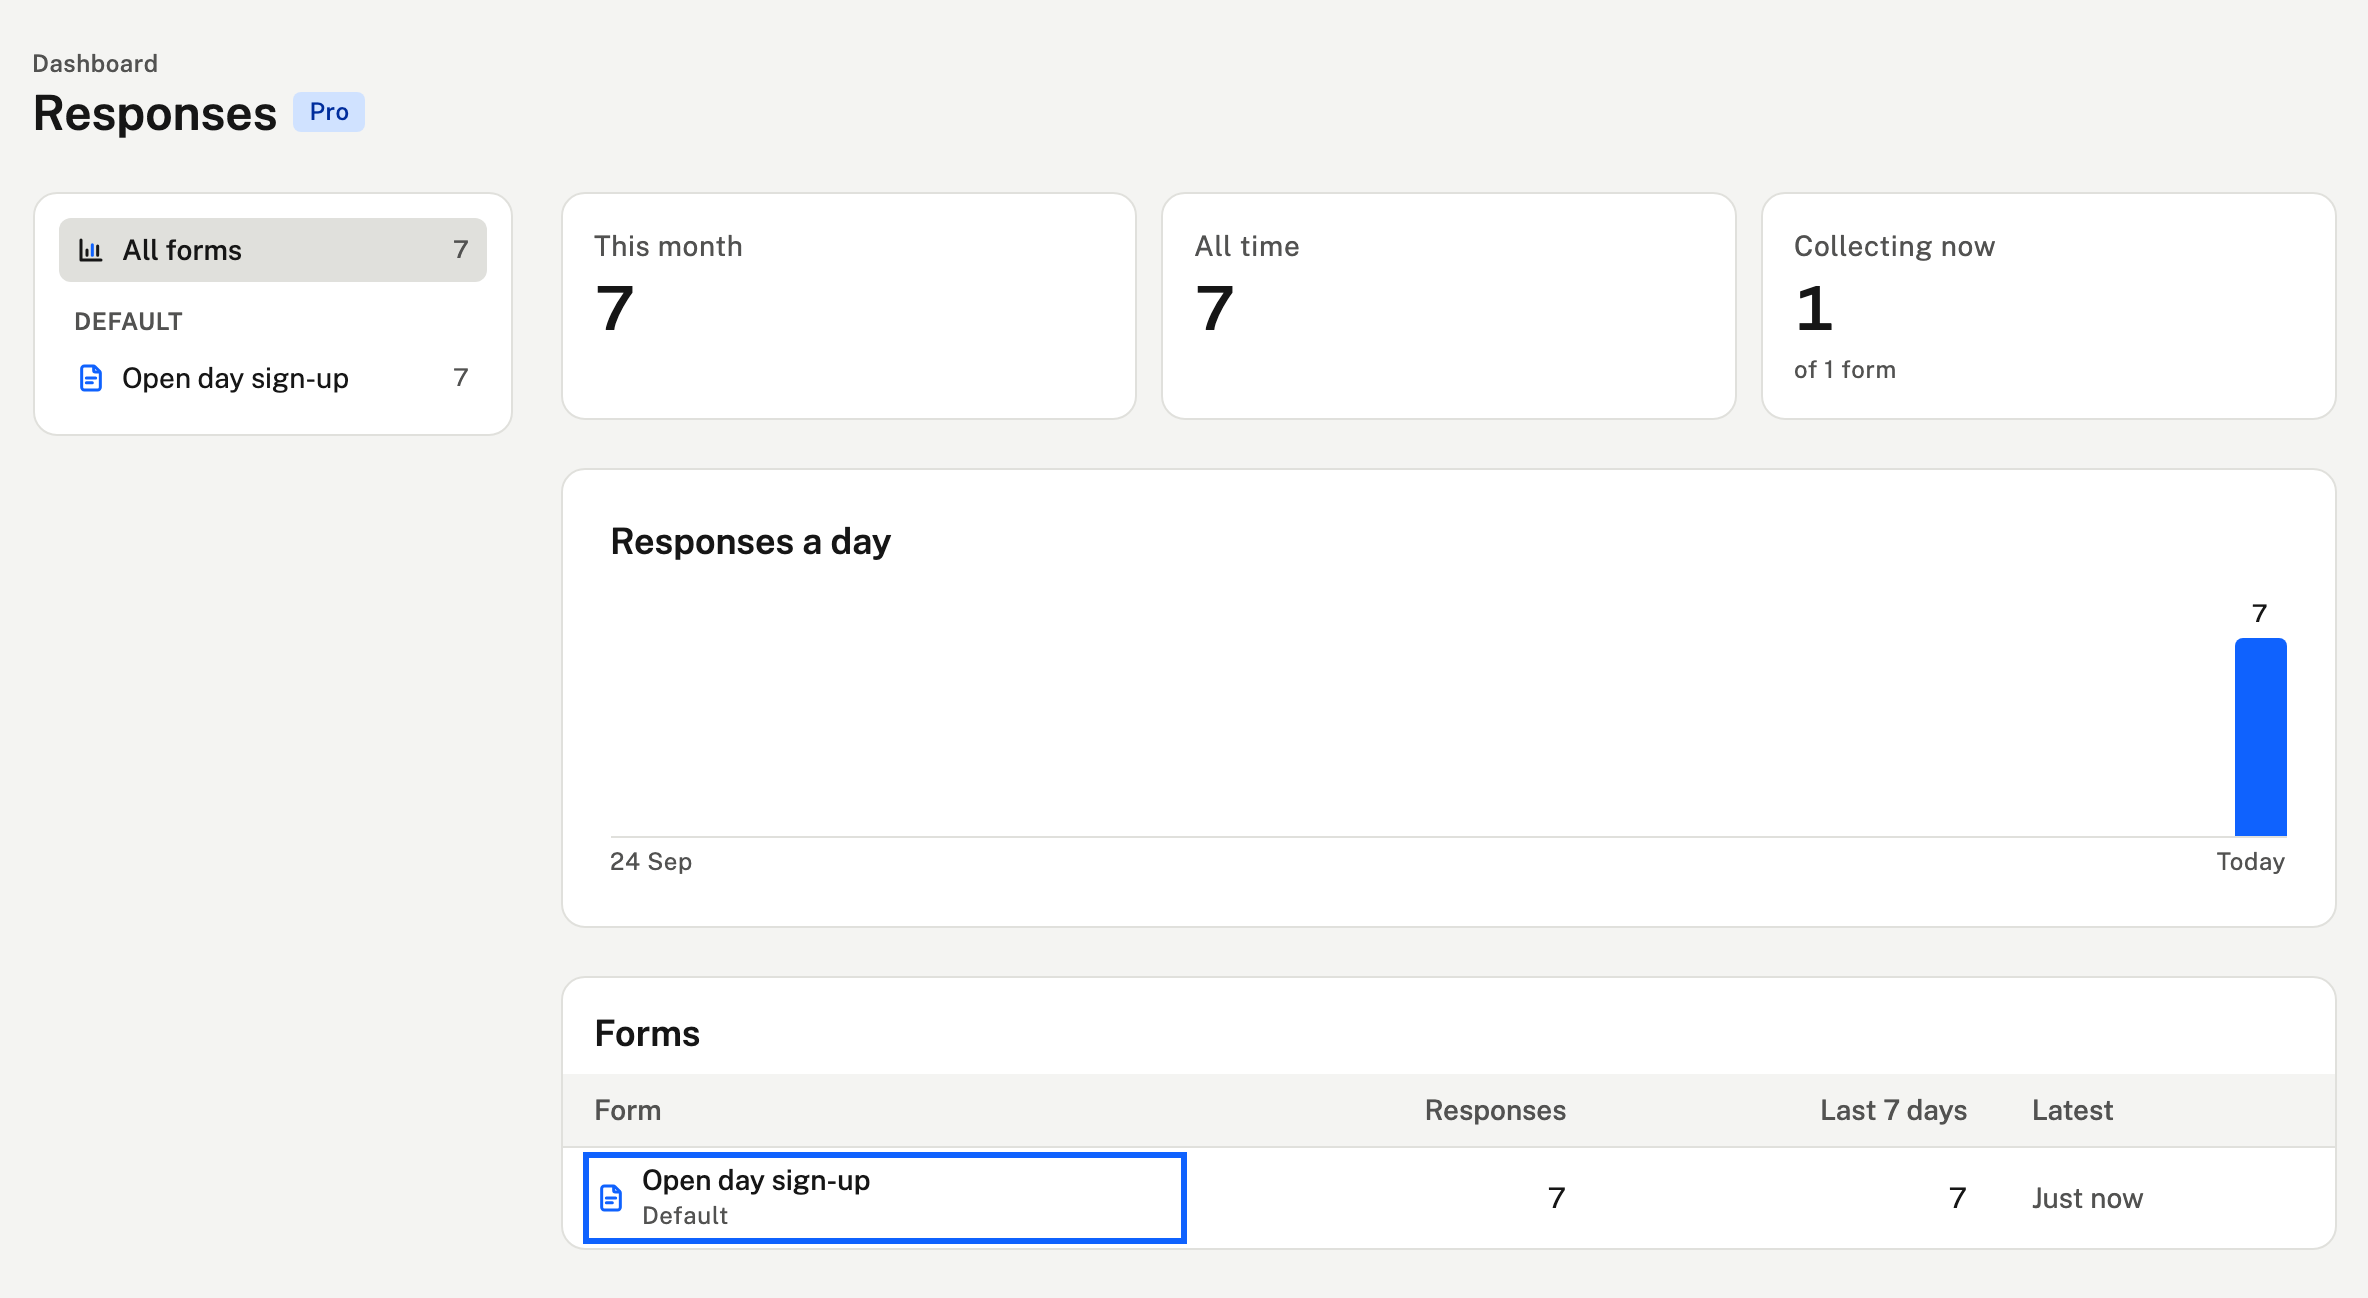
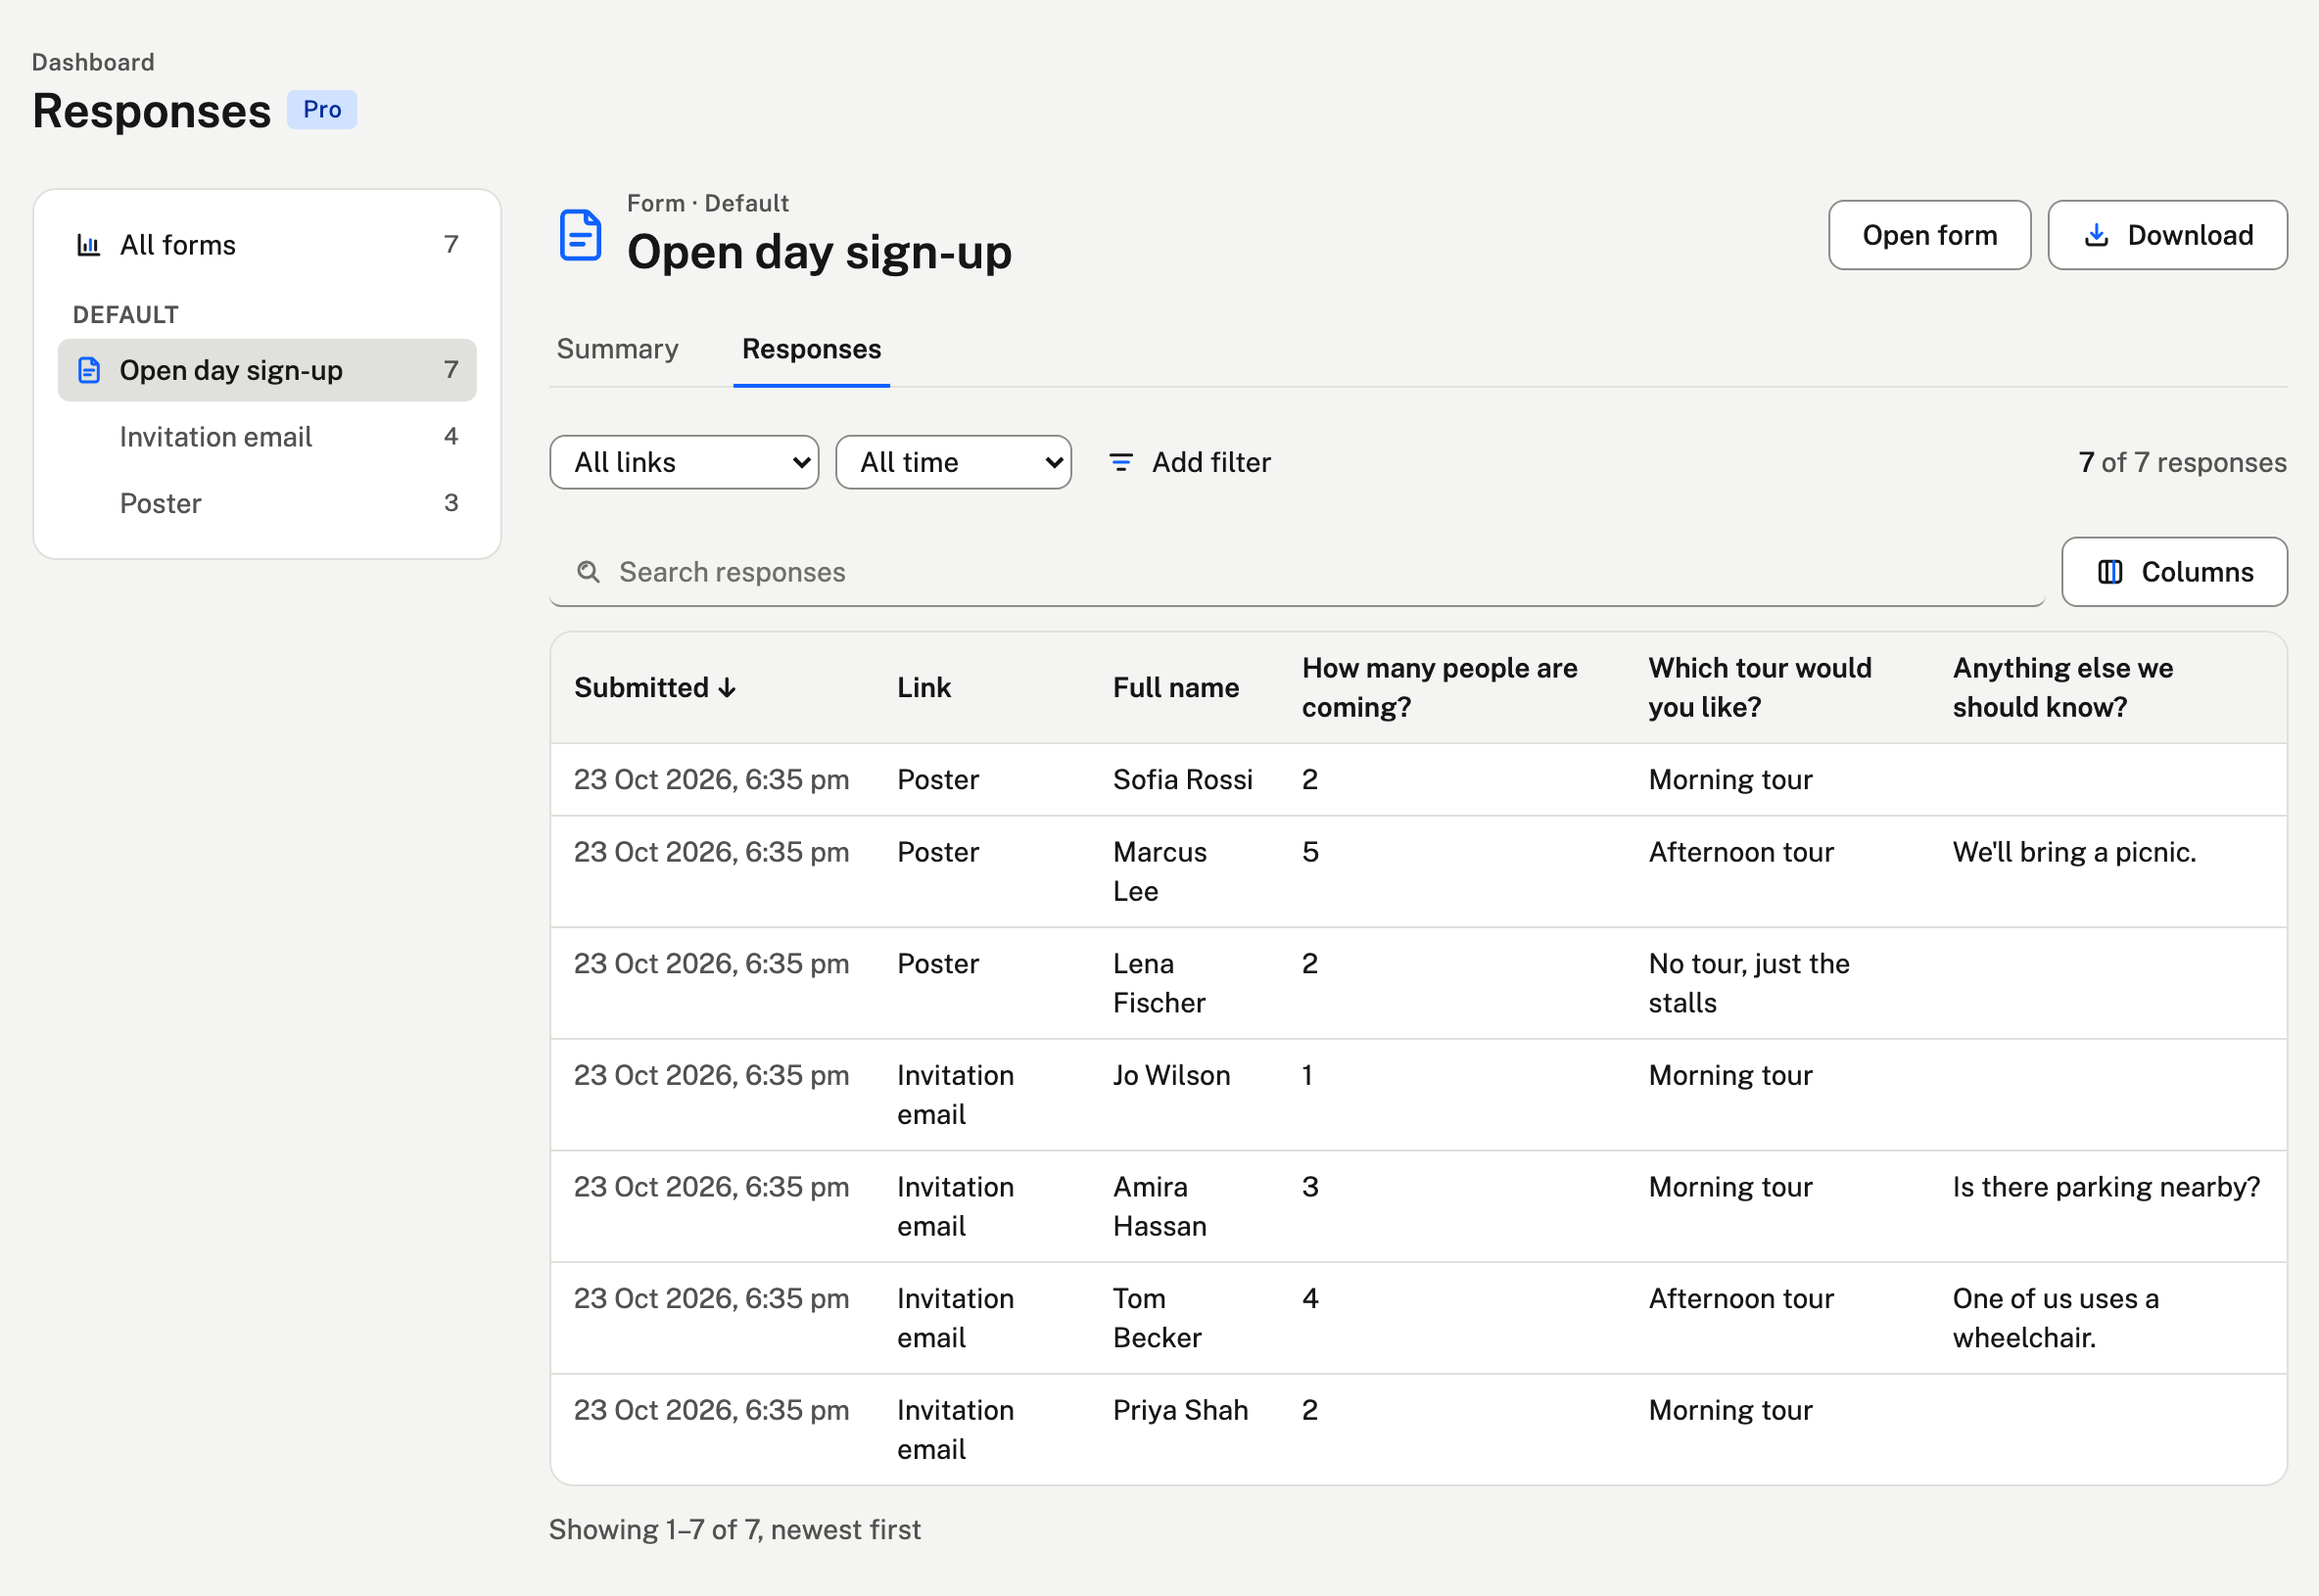
- Responses is every response as a table you can search, sort by when it was sent, and choose the columns of.
- The form's links are listed under it on the left: choose one to see only its responses.
Visits and responses on one link
A link's Analytics tab shows the last 30 days (UTC): responses for each day, and, once you turn on Count visits to this link, how many times the form was opened and what share of visits ended in a response. Counting is off until you turn it on, and starts from then. It adds one to a number for the day and keeps nothing about who opened the form.
With counting on, the tab also shows Where people stop: how many people answered each question, against the question most people answered. A person is counted once for each question, the first time they fill it in, even if they leave without sending the form. Like visits, it's a number for the day and keeps nothing about who. The tab also shows the average time people took, from their first answer to sending the form. Times over an hour are ignored, in case someone left the form open. The dashboard's overview adds these up across your forms for the last 30 days, counting only links that count visits.
Filters
- Choose a link and a time (the last 7, 30 or 90 days, or all time).
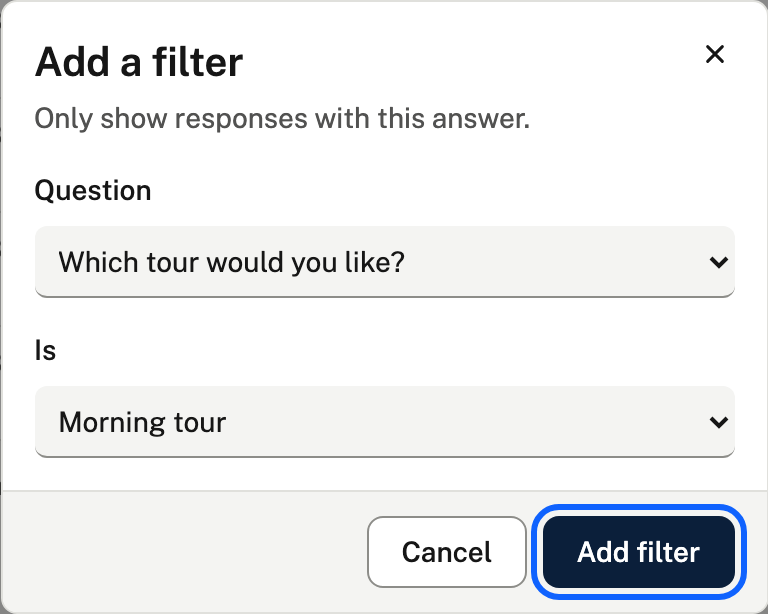
- Add filter narrows them by an answer: an option chosen, a number or date between two values, or text an answer contains.
- Download gives you just the responses that match, as CSV or JSON.